Data Science Projects with Python
On this page, you'll find projects I've done with Python!
Please click on the project title to access my Github codes.
Table of Content
IBM Recommendation Engine with Python
This project was designed to analyze the interactions that users have with articles on the IBM Watson Studio platform, and make recommendations to them about new articles that they might be interested in.
PROJECT INFORMATION
- Exploratory Data Analysis
- Rank Based Recommendations: Here, I begin by finding the most popular articles based on the most interactions. These articles are the ones that we might recommend to new users.
- User-User Based Collaborative Filtering: In order to give better recommendations to the users of IBM's platform, I examine users that are similar in terms of the items they have interacted with. These items could then be recommended to similar users.
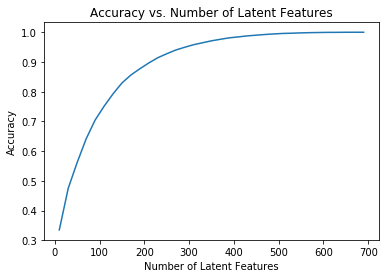
- Matrix Factorization: For the final step, I created a machine learning approach to building recommendations. Using the user-item interactions, I built out a matrix decomposition which helps me in predicting new articles an individual might interact with .
Disaster Response Pipeline Project
PROJECT INFORMATION
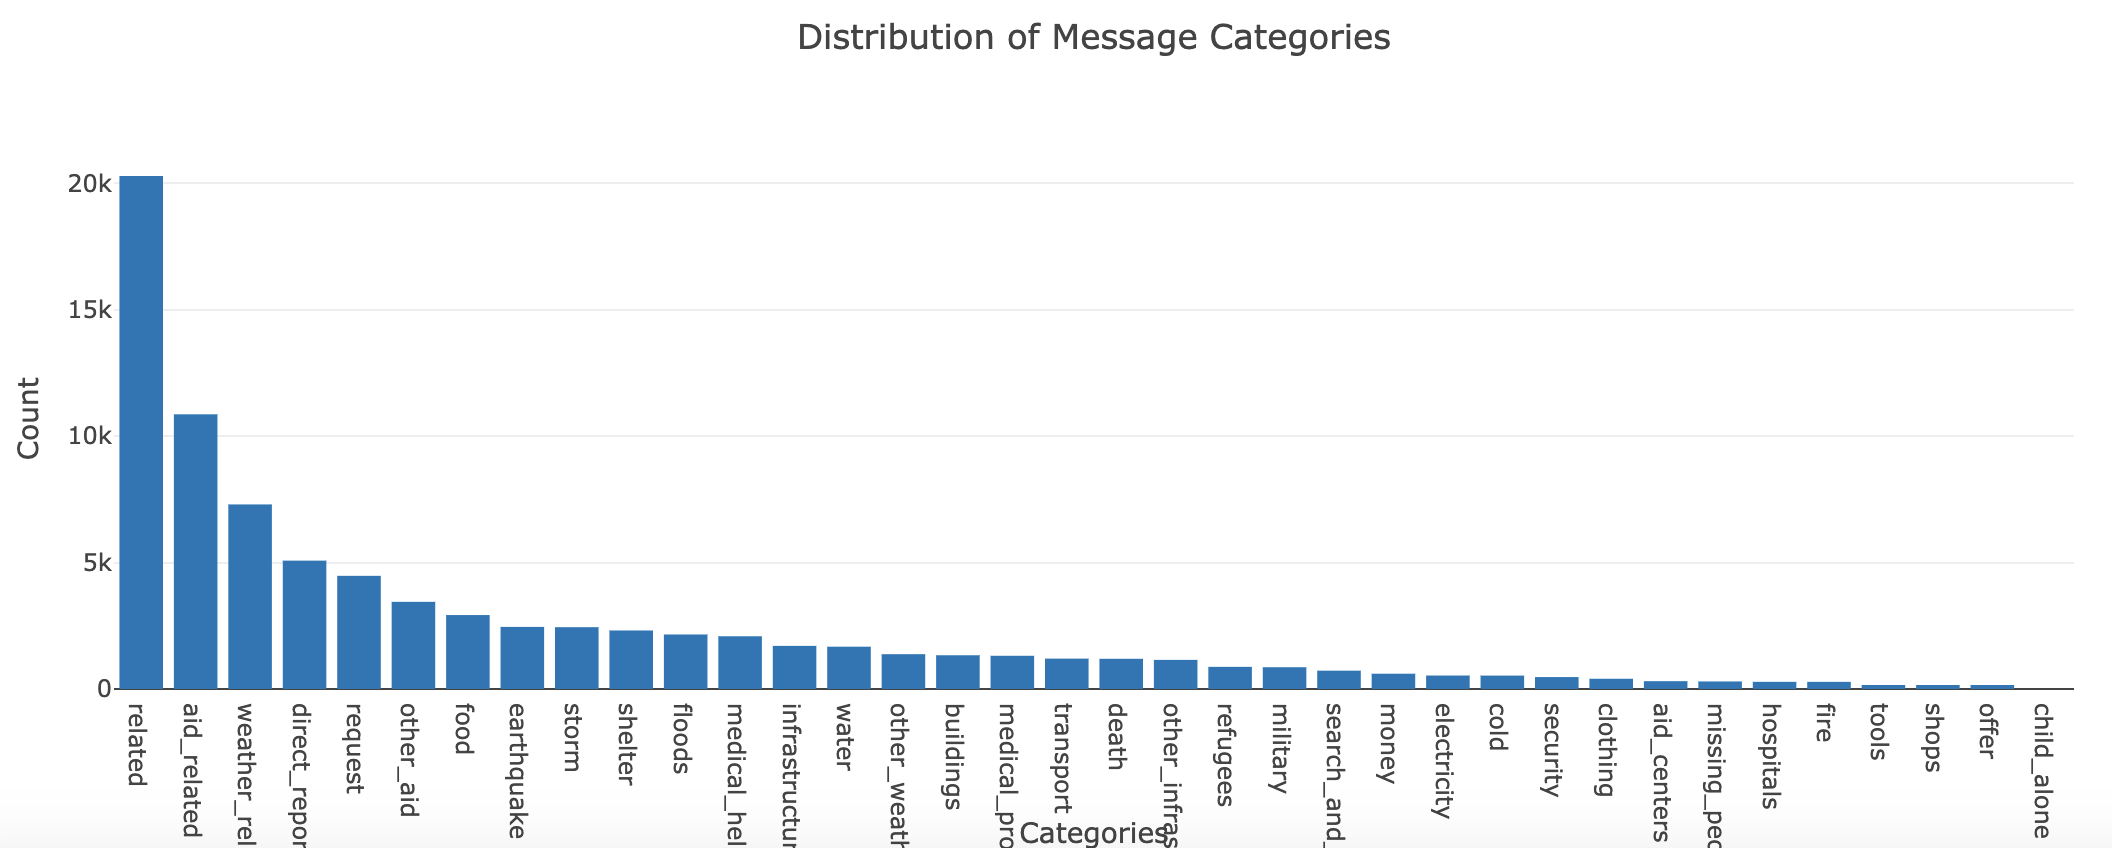
In this project, I will create a machine learning/NLP pipeline to categorize these events and build a model to classify messages that
are sent during disasters. There are 36 pre-defined categories, and examples of these categories include Aid Related, Medical Help,
Search And Rescue, etc. By classifying these messages, we can allow these messages to be sent to the appropriate disaster relief agency.
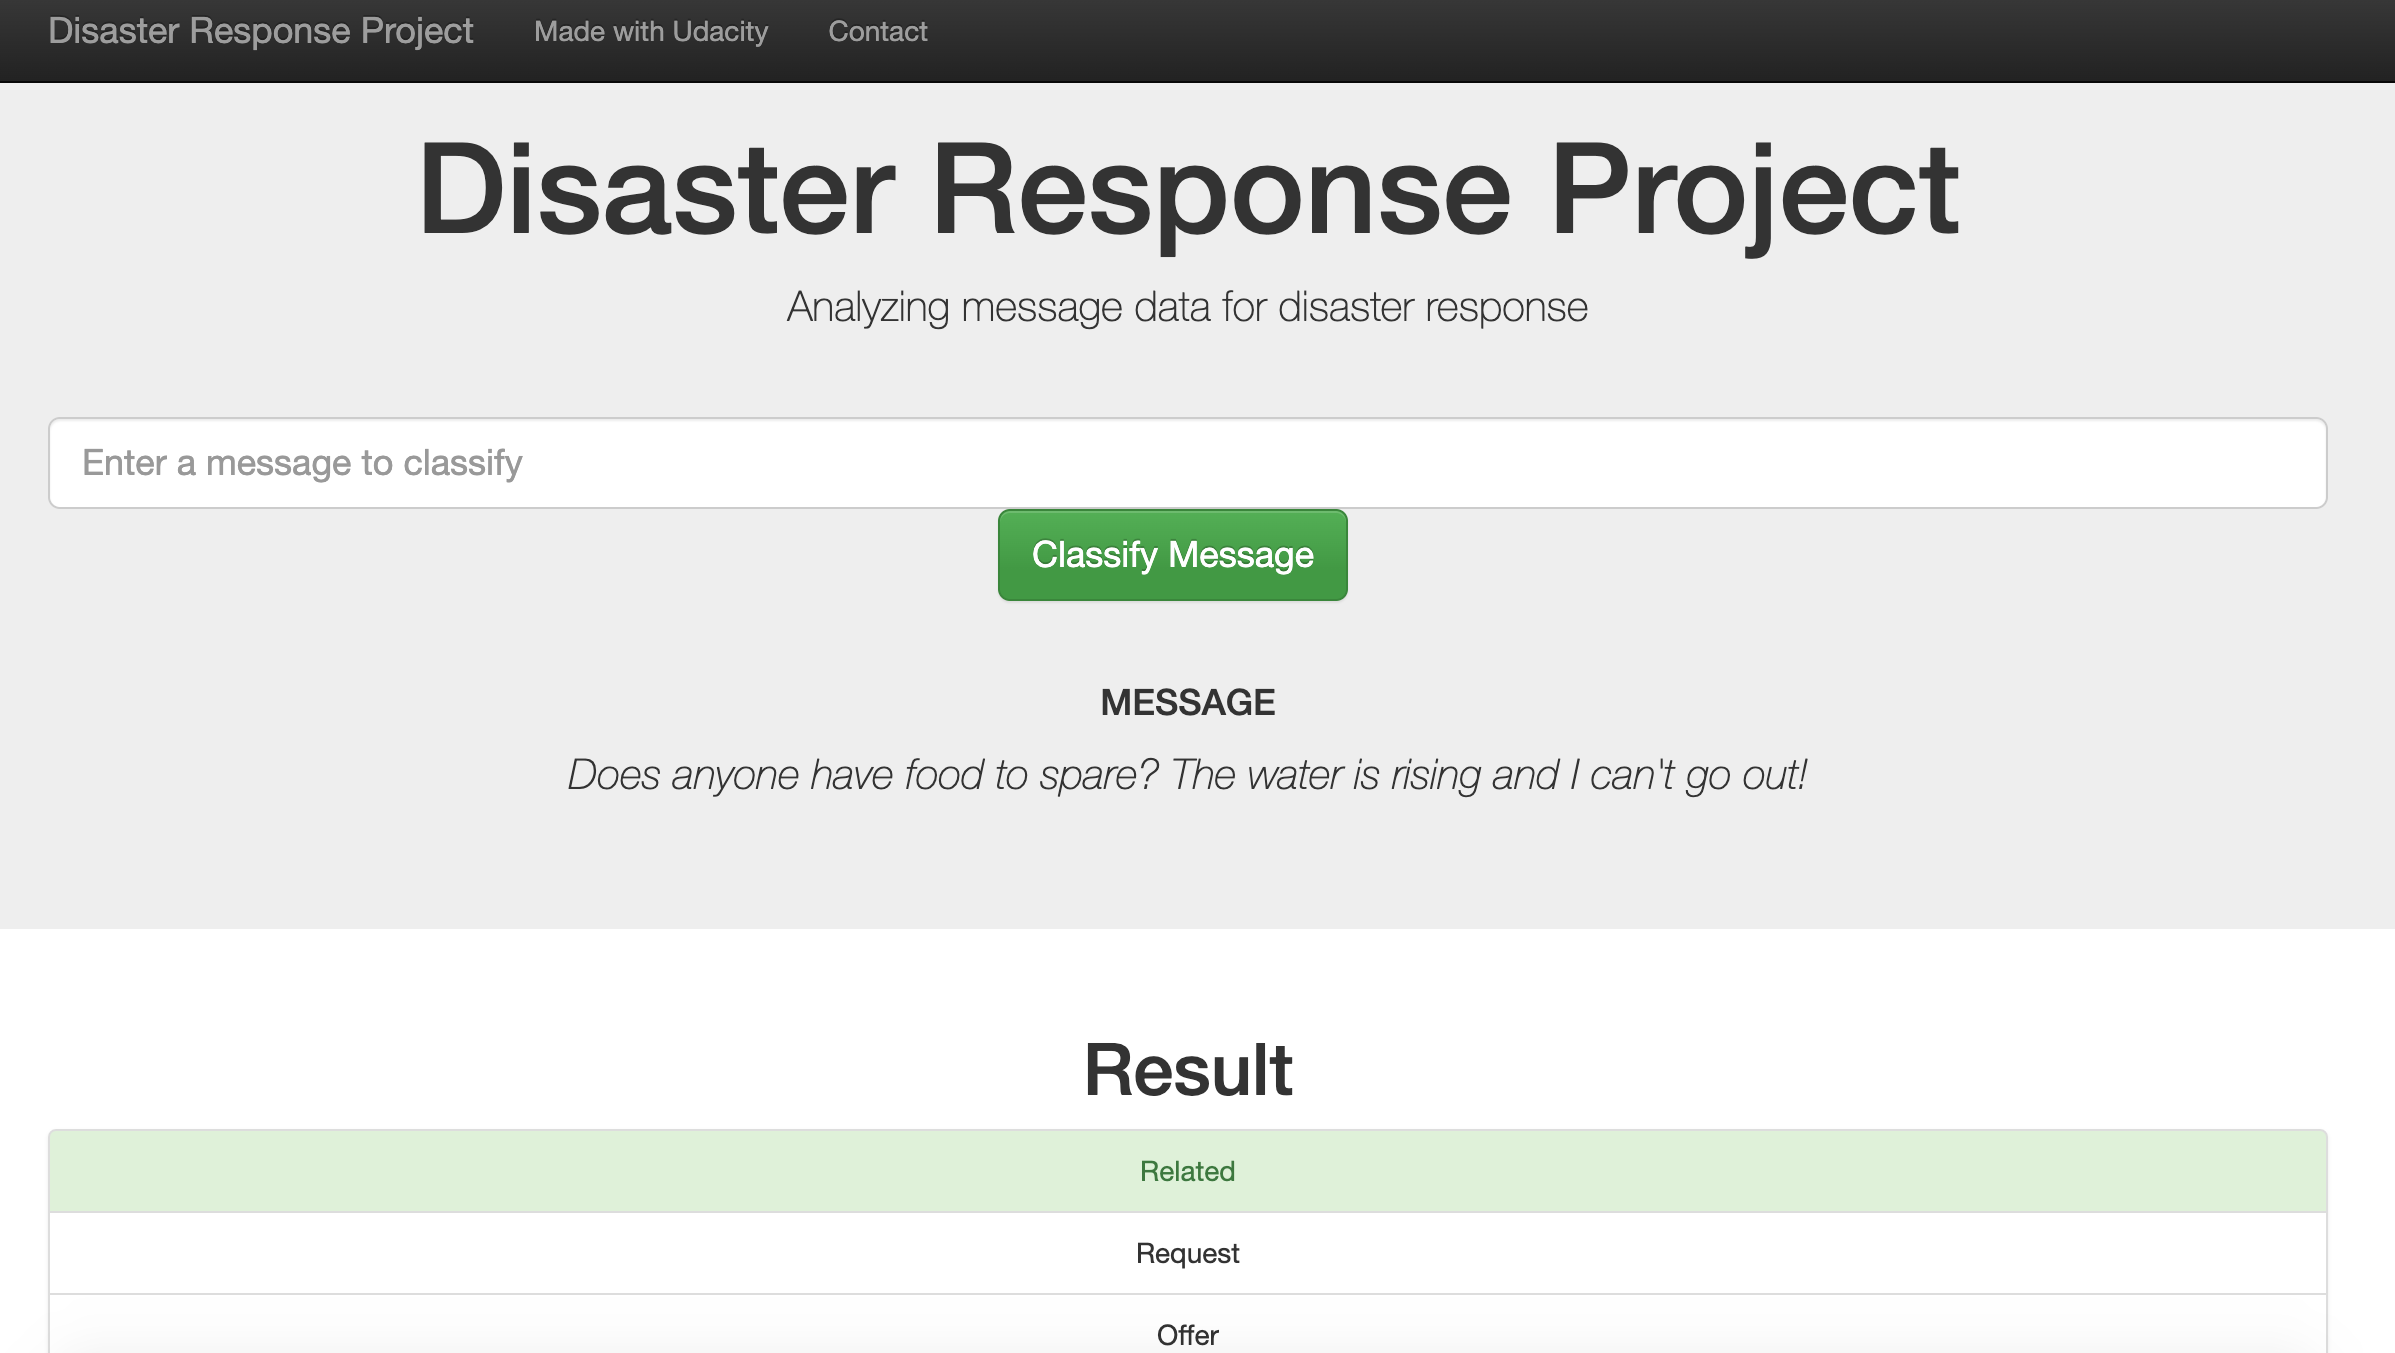
The dataset -provided by Figure Eight- is used to build a model that classifies disaster messages, while the web app is where a respondent
can input a new message and get classification results in several categories.
 Finally, this project also contains a web app that allows you to input a message and get classification results.
Starbucks Challenge
PROJECT INFORMATION
Starbucks, one of the world’s most popular coffee shops, frequently provides offers to its customers through its rewards
app to drive more sales. These offers can be merely an advertisement for a drink or an actual offer such as a discount or
BOGO (buy one get one free).
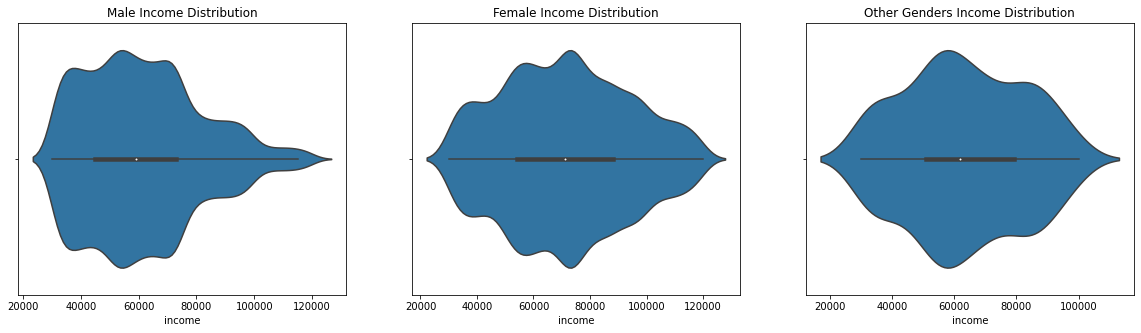 The goal of this project is to find some factors and build a machine learning(ML) that predicts what makes a customer
complete an offer(regardless of the offer type). I am mostly interested in the demographics as I believe that they are bigger
factors than the offer types.
The goal of this project is to find some factors and build a machine learning(ML) that predicts what makes a customer
complete an offer(regardless of the offer type). I am mostly interested in the demographics as I believe that they are bigger
factors than the offer types.
Firstly, to best analyze the data thoroughly, Exploratory Data Analysis(EDA) is performed to find the data representations & characteristics. In this step, I will get to know the data better, as well as clean it. Secondly, with the data provided, I will answer the above questions with the help of charts and various ML models which will be fed the data from a merged dataset which consists of the following: portfolio, profile, transactional.
London Crime Analysis & Hypothesis Testing (2008-2016)
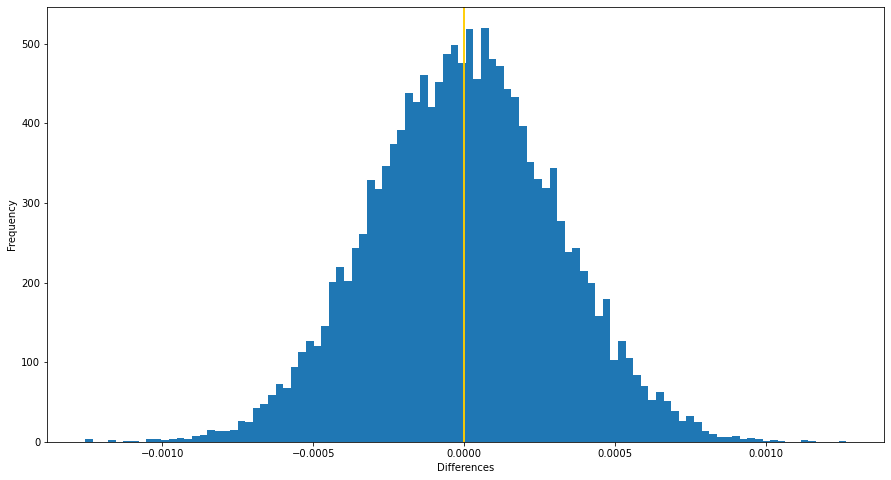
In this project, I am interested in working to understand the crime rate in London, England. My goal is to work through this notebook to understand violent crime rates and when they are likely to occur throughout the year. This dataset contains all crimes (non-violent and violent) committed between 2008 and 2016. However, the nature of the crime-violent or non-violent- is not specified in this dataset, so we will need to deal with that during the preprocessing phase. We will also need to specify which months are the ones when daylight saving is in effect.
Project Information
There are a total of 2 notebooks dedicated to this project. This first notebook(London Crime Hypothesis Testing.ipynb) is dedicated to testing the individual factors(borough/location & daylight saving) that I think may affect the violent crime rate while the second notebook(London Crime Hypothesis Testing Part II.ipynb) to testing the interactions between location/borough and daylight saving for any significant effect on the rate.
My initial assumption is that violent crime rates increase when daylight saving is not in effect, which means that the night is longer. Therefore, our hypothesises are:
- Null Hypothesis: The difference between the violent crime rates when daylight saving is and isn't in effect is less than or equal to 0.
- Alternative Hypothesis: The difference between the violent crime rates when daylight saving is and isn't in effect is greater than 0.
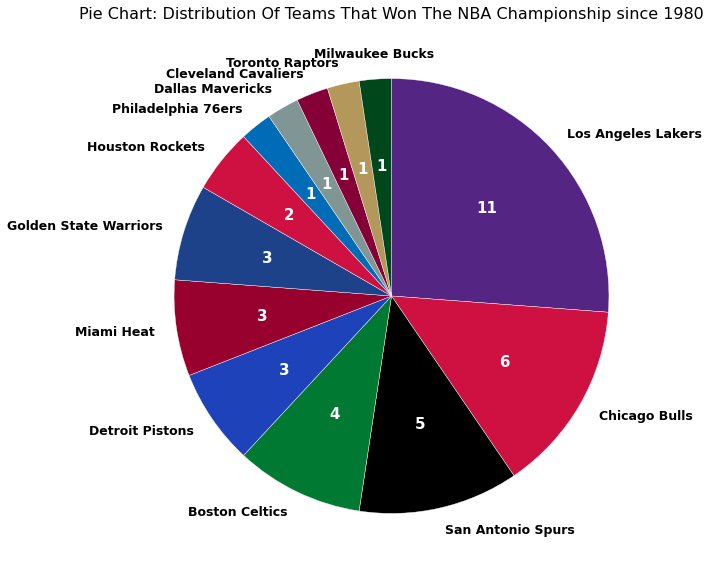
NBA Teams Offensive Data Exploration (1980-2021)
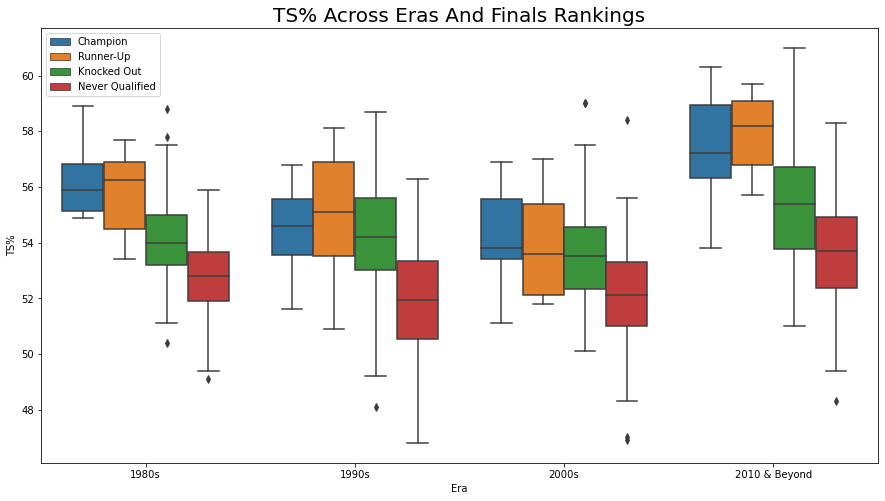
For this project, I am mainly interested in conducting data exploration and analysis on the offensive stats and characteristics of different NBA teams between 1980 and 2021 based on Finals ranking which is a new column I will create that contains 4 values: Champion, Runner-Up, Knocked Out and Never Qualified. Knocked Out and Never Qualified implies that they have either been knocked out of or never qualified for the NBA playoffs. Some stats that you will see me analyze and visualize are Margin of Victory(MOV), 3P%, Age and shot attempts.
Project Information
To begin, I scraped data from the Basketball Reference website, which contains each team's performances throughout the years. I scraped a total of 4 different stats tables from the website and stored them in 4 different datasets. In this notebook, I used 3 different packages: Pandas, BeautifulSoup and Requests.
I will then clean the data. Some steps I took here are dealing with null values, dropping unneeded columns, converting datatypes and cleaning up the values. After cleaning up the data, I merged 4 of the datasets into 2. I have also created a new column to indicate the NBA teams' Finals ranking in this notebook. One consists of the teams' total stats per year and one consists of the average stats per game for each year. In this notebook, I used 2 different packages: Pandas and Numpy.
Lastly, I will analyze and create some visualizations of the stats. I started off by analyzing the total stats first to get a broad picture view by conducting and creating visuals for univariate and bivariate exploration. Afterward, I moved onto the average stats per game of each year where I conducted the same type of explorations along with multivariate exploration. You will find that I have also created a couple categorical variables for my analysis as well. In this notebook, I used 5 different packages: Pandas, Numpy, Seaborn, Matplotlib and Warnings. You will find the majority of the multivariate exploration near the end and a lengthy conclusion.
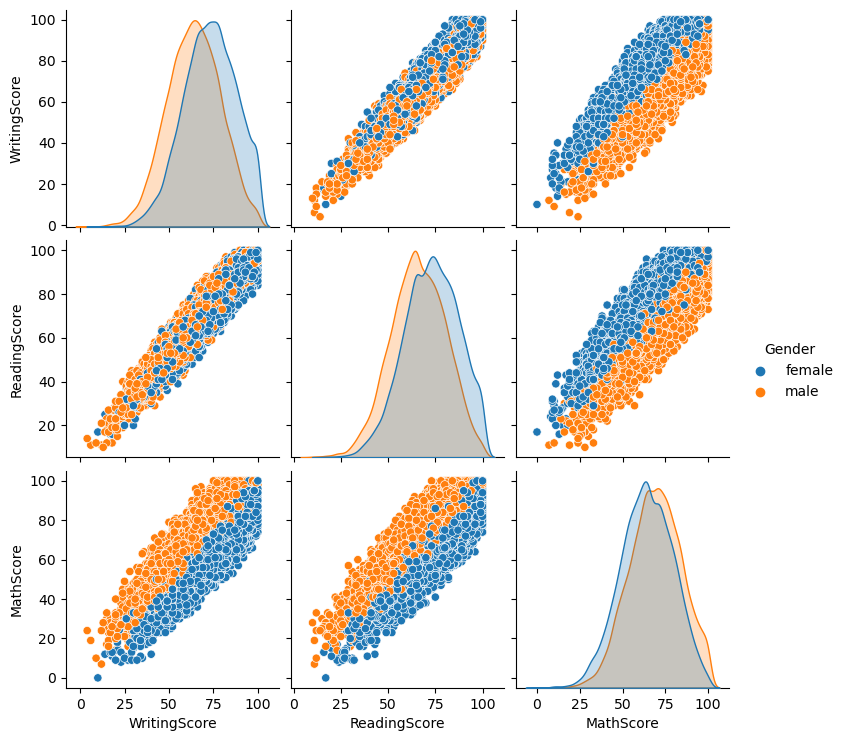
Students Exam Scores: EDA & Data Modeling
In this section, I will be performing EDA and modeling to predict whether students will pass or fail a specific test. The three subjects represented are reading, writing and math. Some of the models I'll try out are SVM, Random Forest, and KNN. Addtionally, I will also get my hands dirty with clustering. This is a group project done with 2 other classmates as part of SMU's Masters in Data Science degree for the class Machine Learning 1.