DDSAnalytics is an analytics company that specializes in talent management solutions for Fortune 100 companies.
Talent management is defined as the iterative process of developing and retaining employees. It may include workforce planning, employee training programs,
identifying high-potential employees and reducing/preventing voluntary employee turnover (attrition). To gain a competitive edge over its
competition, DDSAnalytics is planning to leverage data science for talent management. The executive leadership has identified predicting
employee turnover as its first application of data science for talent management.
PROJECT INFORMATION
In this project, I will identify the top three factors that contribute to turnover (backed up by evidence provided by analysis).
The business is also interested in learning about any job role specific trends that may exist in the data set. You can also provide
any other interesting trends and observations from your analysis. The analysis is backed up by robust experimentation and appropriate
visualization.
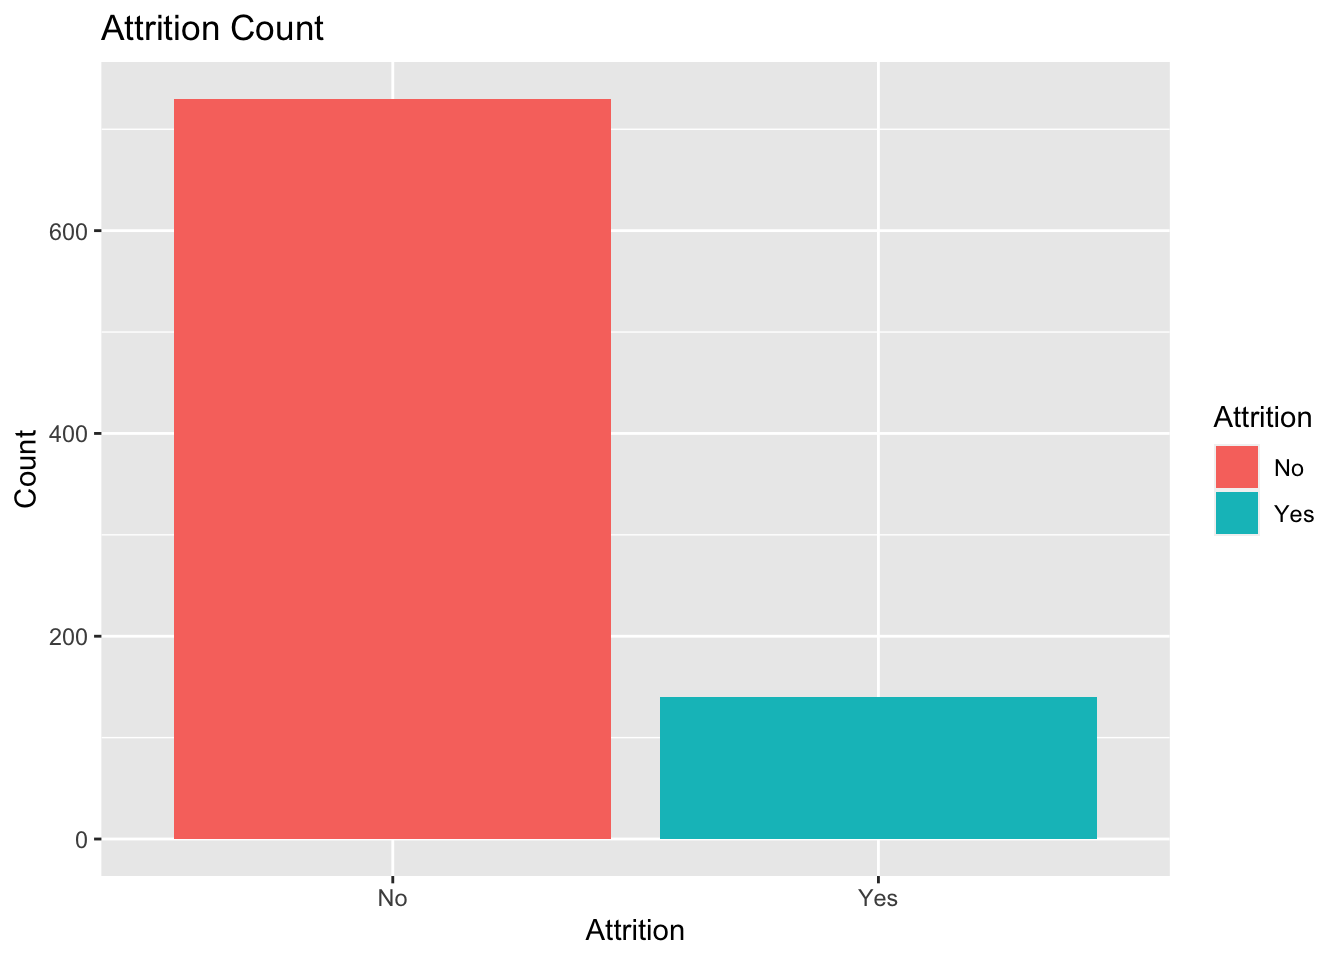
There are two goals to this project. First, we want to find factors that lead to attrition and determine monthly income with EDA.
Secondly , we want to build two prediction models with our chosen factors that can accurately predict both of the variables mentioned
above. Lastly, we want to use our model to predict the value of these variables on 2 different test datasets. The two models that we
found work best are the Naive-Bayes model for attrition and Linear Regression model for salary. We also tried the KNN model. Additionally,
a video presentation was also made to address our findings.
Video Presentation
R Markdown
Ask a home buyer to describe their dream house, and they probably won't begin with the height of the basement ceiling or the
proximity to an east-west railroad. But this Kaggle competition's dataset proves that much more influences price negotiations
than the number of bedrooms or the presence of a white-picket fence! With 79 explanatory variables describing (almost) every aspect
of residential homes in Ames, Iowa, this competition challenges you to predict the final price of each home. The entire process will
be done in R and SAS. SAS is used for the first analysis question and variable selection.
PROJECT INFORMATION
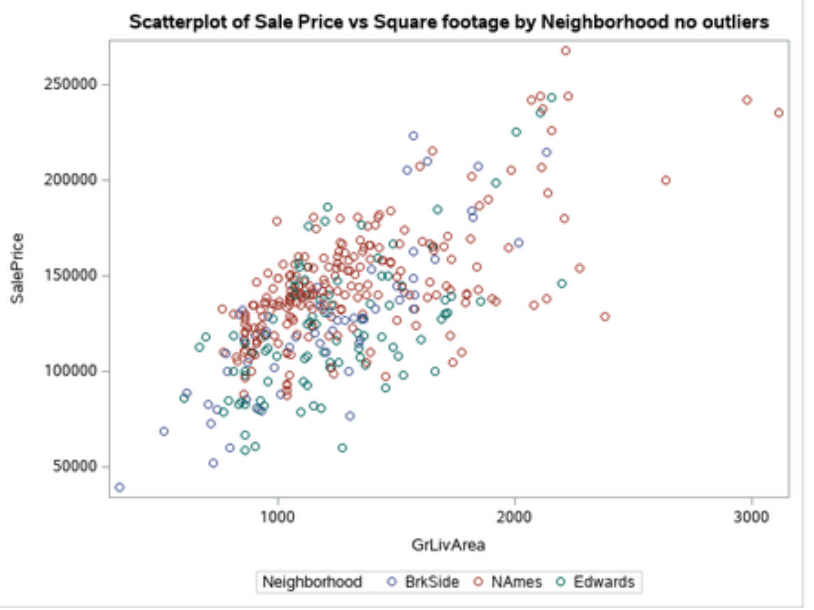
Analysis 1: Century 21 Ames only sells houses in the NAmes, Edwards and BrkSide neighborhoods and would like to simply get
an estimate of how the SalePrice of the house is related to the square footage of the living area of the house (GrLIvArea) and if the SalesPrice
(and its relationship to square footage) depends on which neighborhood the house is located in. Build and fit a model that will answer this question,
keeping in mind that realtors prefer to talk about living area in increments of 100 sq. ft. Provide your client with the estimate (or estimates if it v
aries by neighborhood) as well as confidence intervals for any estimate(s).
For this analysis, we also want to create to make an RShiny app that will display at least display a scatterplot of price of the home v. square
footage (GrLivArea) and allow for the plot to be displayed for at least the NAmes, Edwards and BrkSide neighborhoods separately.
Analysis 2: Build the most predictive model for sales prices of homes in all of Ames Iowa. This includes all neighborhoods.
Your group is limited to only the techniques we have learned in 6371 (no random forests or other methods we have not yet covered).
Specifically, you should produce 4 models: one from forward selection, one from backwards elimination, one from stepwise selection, and
one that you build custom. The custom model could be one of the three preceding models or one that you build by adding or subtracting variables
at your will. Generate an adjusted R-Squared, CV Press and Kaggle Score for each of these models and clearly describe which model you feel is the
best in terms of being able to predict future sale prices of homes in Ames, Iowa. We will use all 4 our models to predict the Saleprice on a test
dataset(test.csv).
In the end, we want to write a 7 page report discussing our findings along with an appendix that includes all of our codes.
Rshiny App
Report
This project was designed to analyze the interactions that users have with articles on the IBM Watson Studio platform,
and make recommendations to them about new articles that they might be interested in.
PROJECT INFORMATION
- Exploratory Data Analysis
- Rank Based Recommendations: Here, I begin by finding the most popular articles based on the most interactions.
These articles are the ones that we might recommend to new users.
- User-User Based Collaborative Filtering: In order to give better recommendations to the users of IBM's platform,
I examine users that are similar in terms of the items they have interacted with. These items could then be recommended to similar
users.
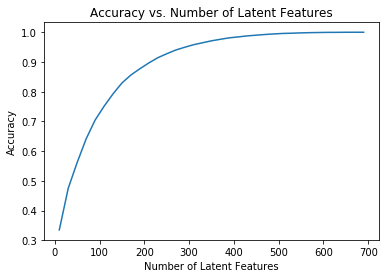
- Matrix Factorization: For the final step, I created a machine learning approach to building recommendations.
Using the user-item interactions, I built out a matrix decomposition which helps me in predicting new articles an individual might interact
with .
PROJECT INFORMATION
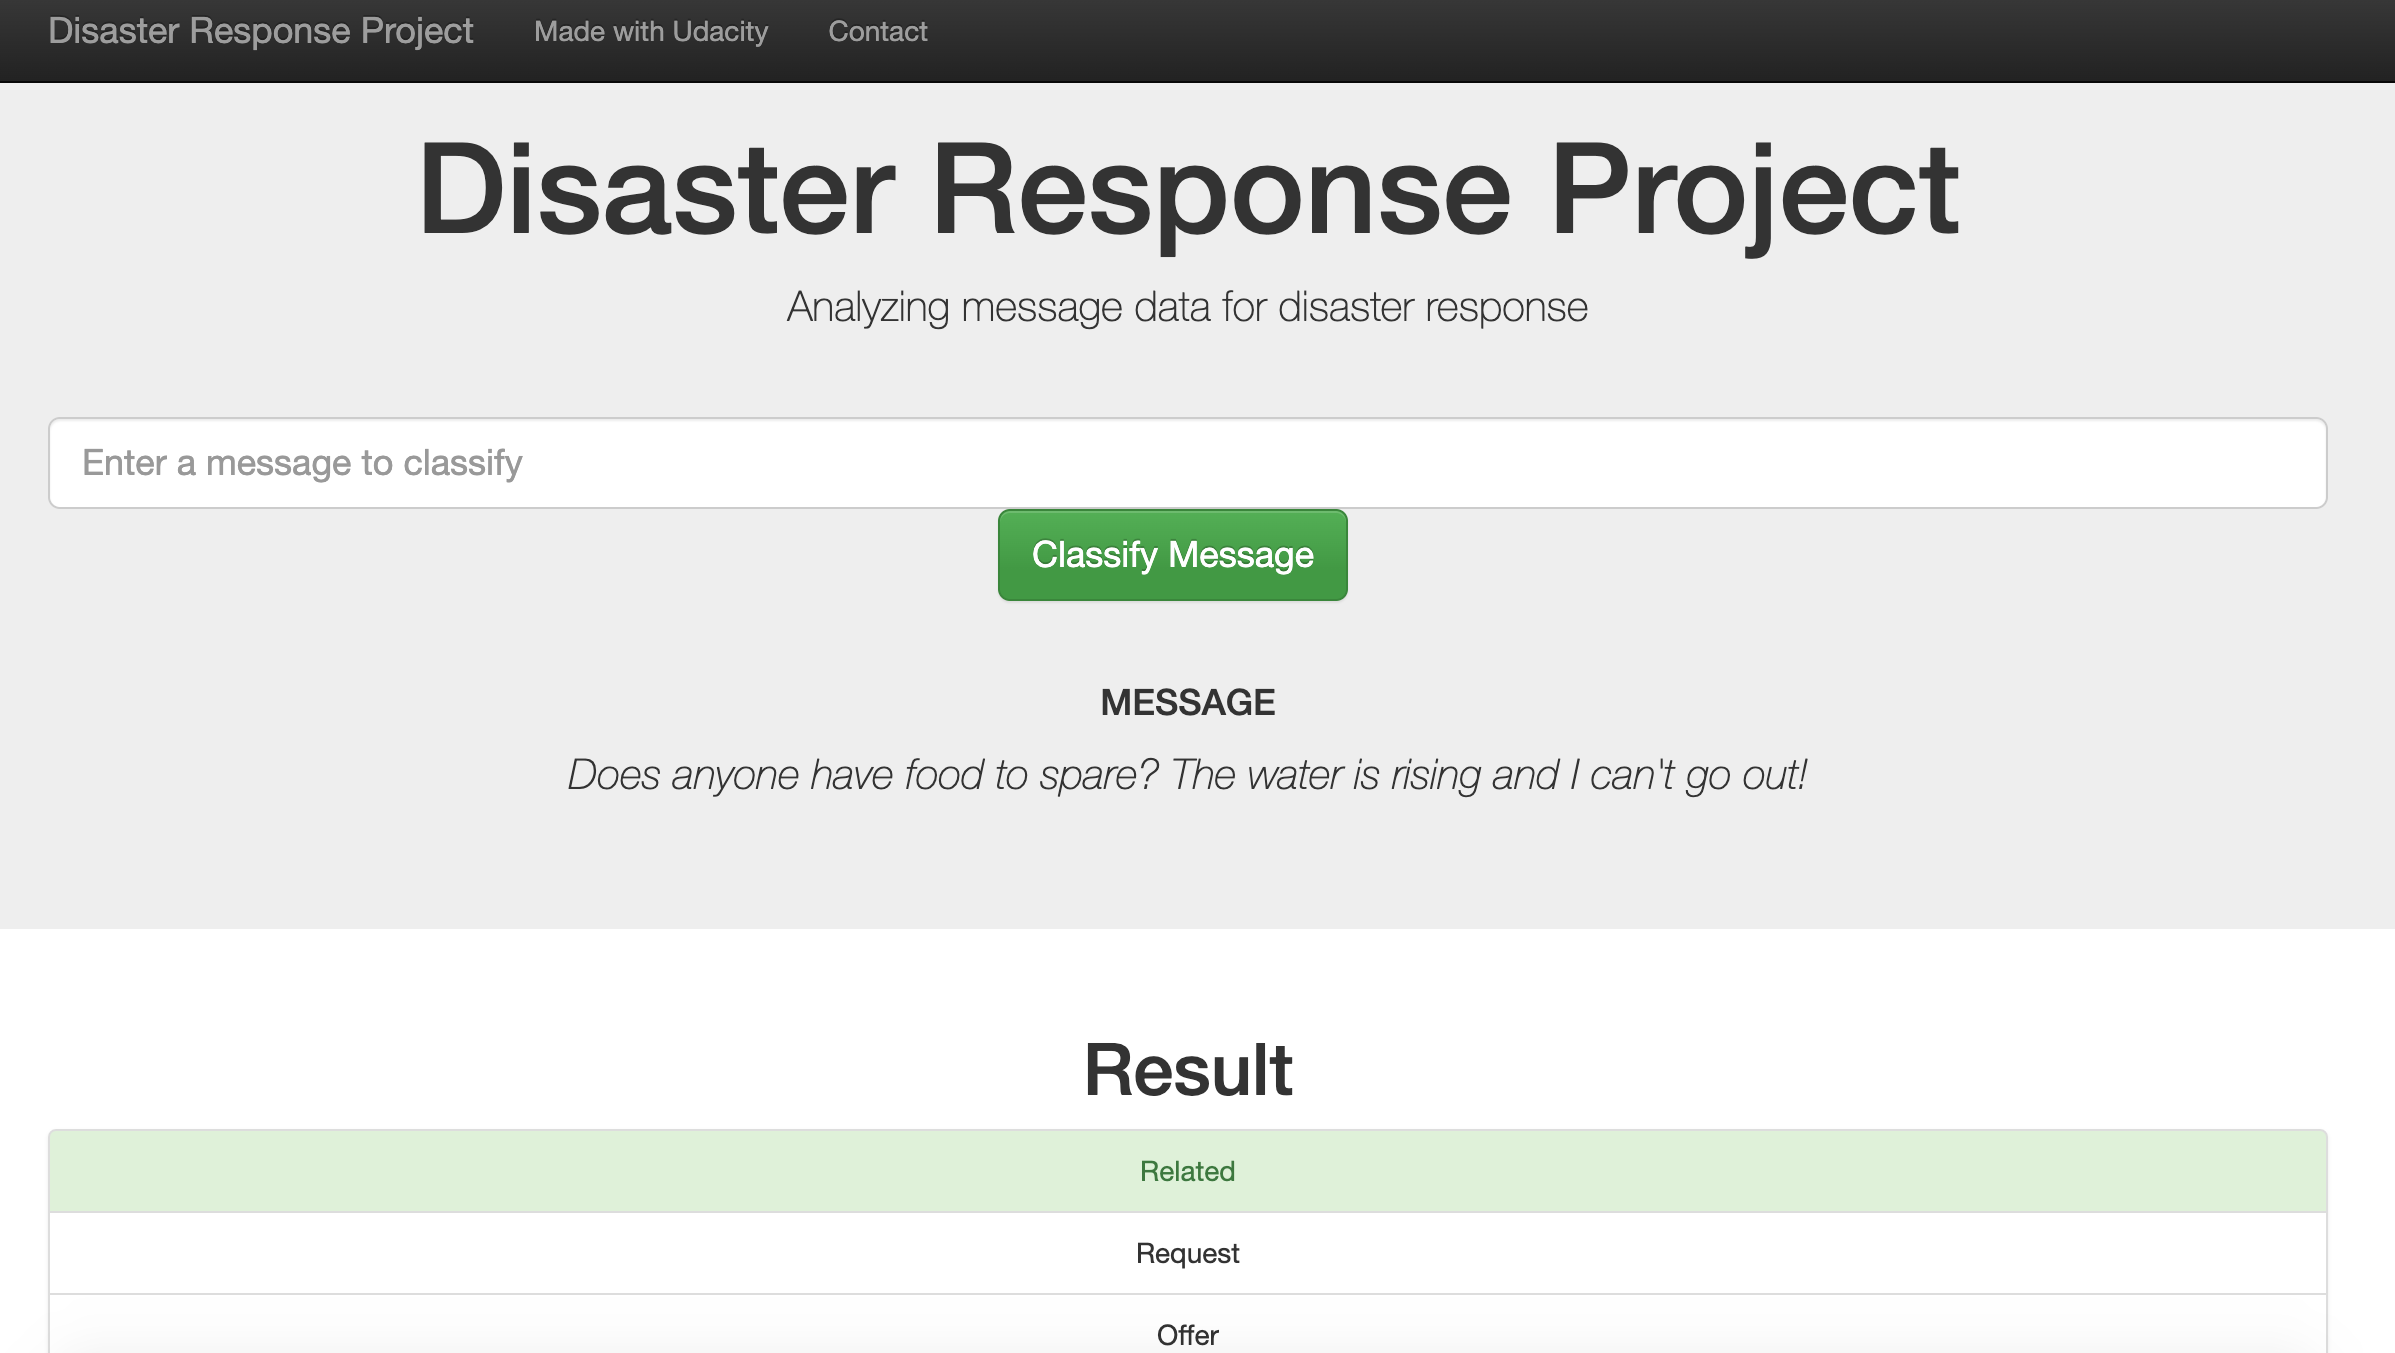
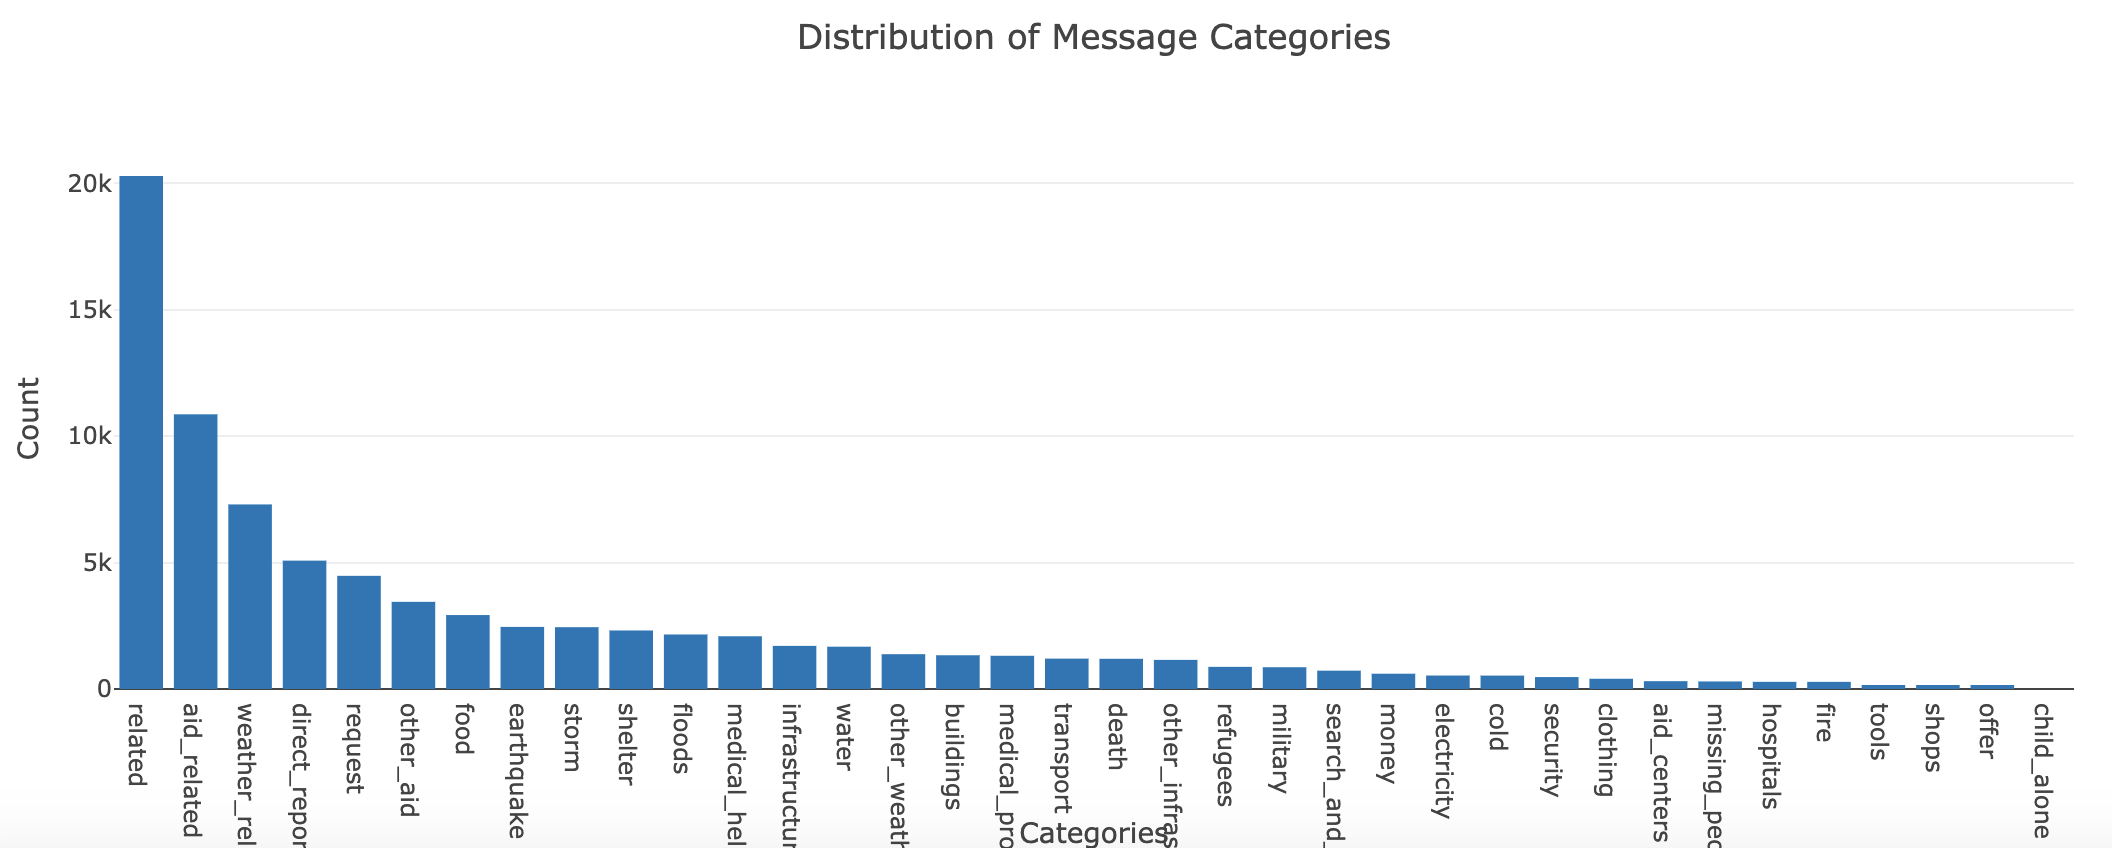
In this project, I will create a machine learning/NLP pipeline to categorize these events and build a model to classify messages that
are sent during disasters. There are 36 pre-defined categories, and examples of these categories include Aid Related, Medical Help,
Search And Rescue, etc. By classifying these messages, we can allow these messages to be sent to the appropriate disaster relief agency.
The dataset -provided by Figure Eight- is used to build a model that classifies disaster messages, while the web app is where a respondent
can input a new message and get classification results in several categories.
 Finally, this project also contains a web app that allows you to input a message and get classification results.
PROJECT INFORMATION
Starbucks, one of the world’s most popular coffee shops, frequently provides offers to its customers through its rewards
app to drive more sales. These offers can be merely an advertisement for a drink or an actual offer such as a discount or
BOGO (buy one get one free).
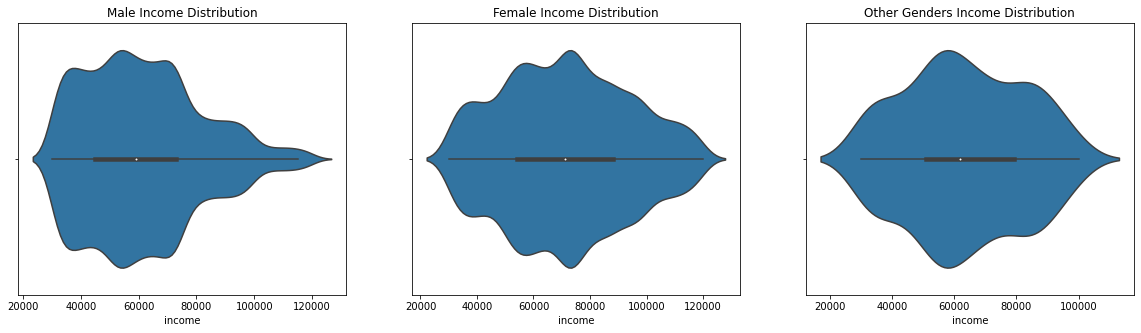 The goal of this project is to find some factors and build a machine learning(ML) that predicts what makes a customer
complete an offer(regardless of the offer type). I am mostly interested in the demographics as I believe that they are bigger
factors than the offer types.
The goal of this project is to find some factors and build a machine learning(ML) that predicts what makes a customer
complete an offer(regardless of the offer type). I am mostly interested in the demographics as I believe that they are bigger
factors than the offer types.
Firstly, to best analyze the data thoroughly, Exploratory Data Analysis(EDA) is performed to find the data representations &
characteristics. In this step, I will get to know the data better, as well as clean it. Secondly, with the data provided, I
will answer the above questions with the help of charts and various ML models which will be fed the data from a merged dataset
which consists of the following: portfolio, profile, transactional.
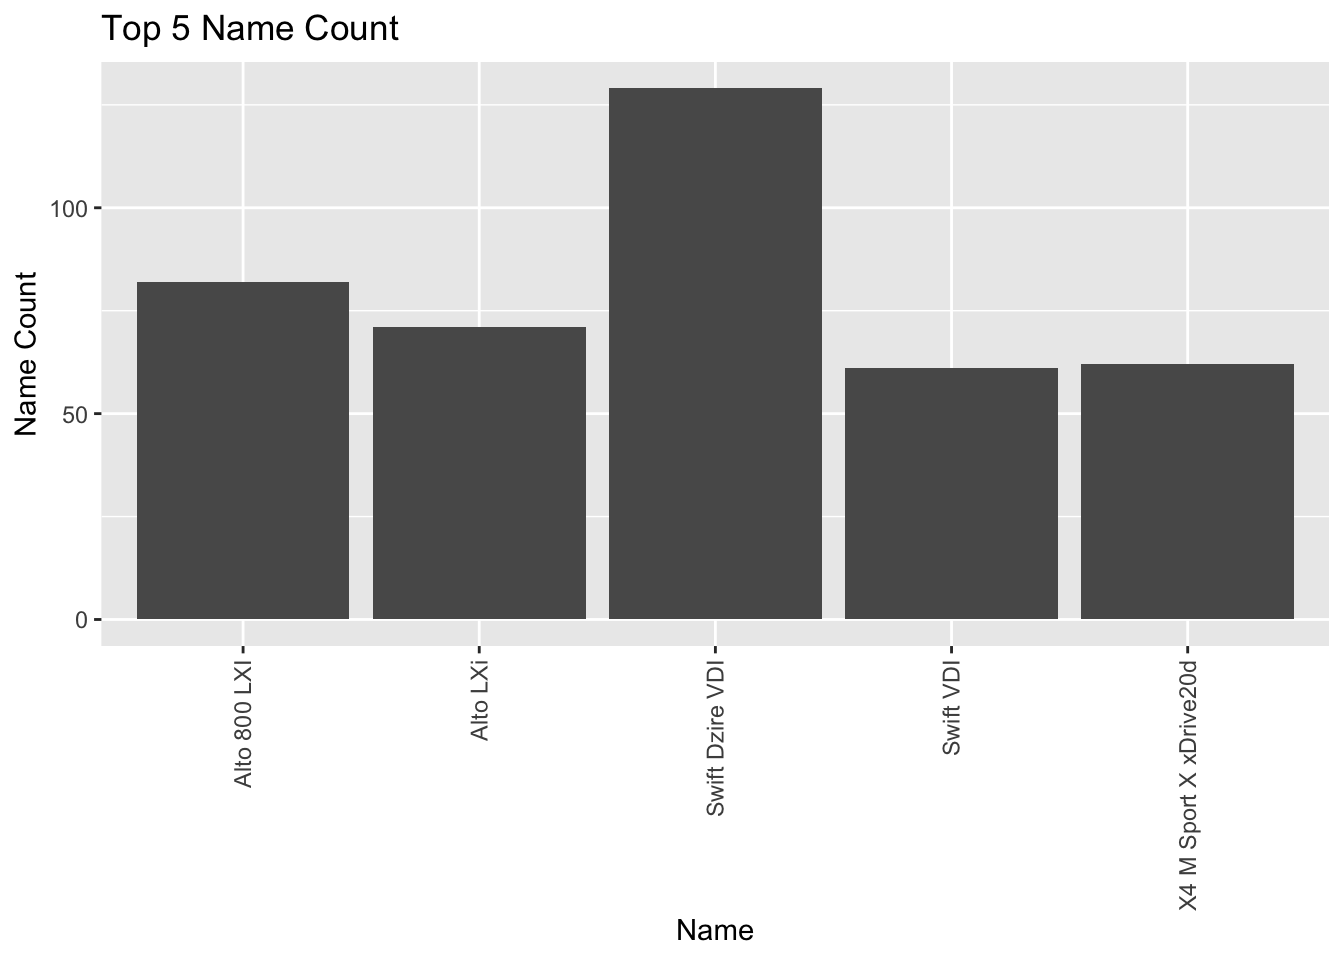
In this project, we want to create a model that can best predict used car prices. Our team was tasked to identify any relationships between
the selling prices and the other variables. Our variable selection methodologies includes, but not limited to, forward selection, backward
selection, stepwise selection, etc. Since this is an observational study our conclusions are limited to the data included in our analysis.
Video Presentation
R Markdown
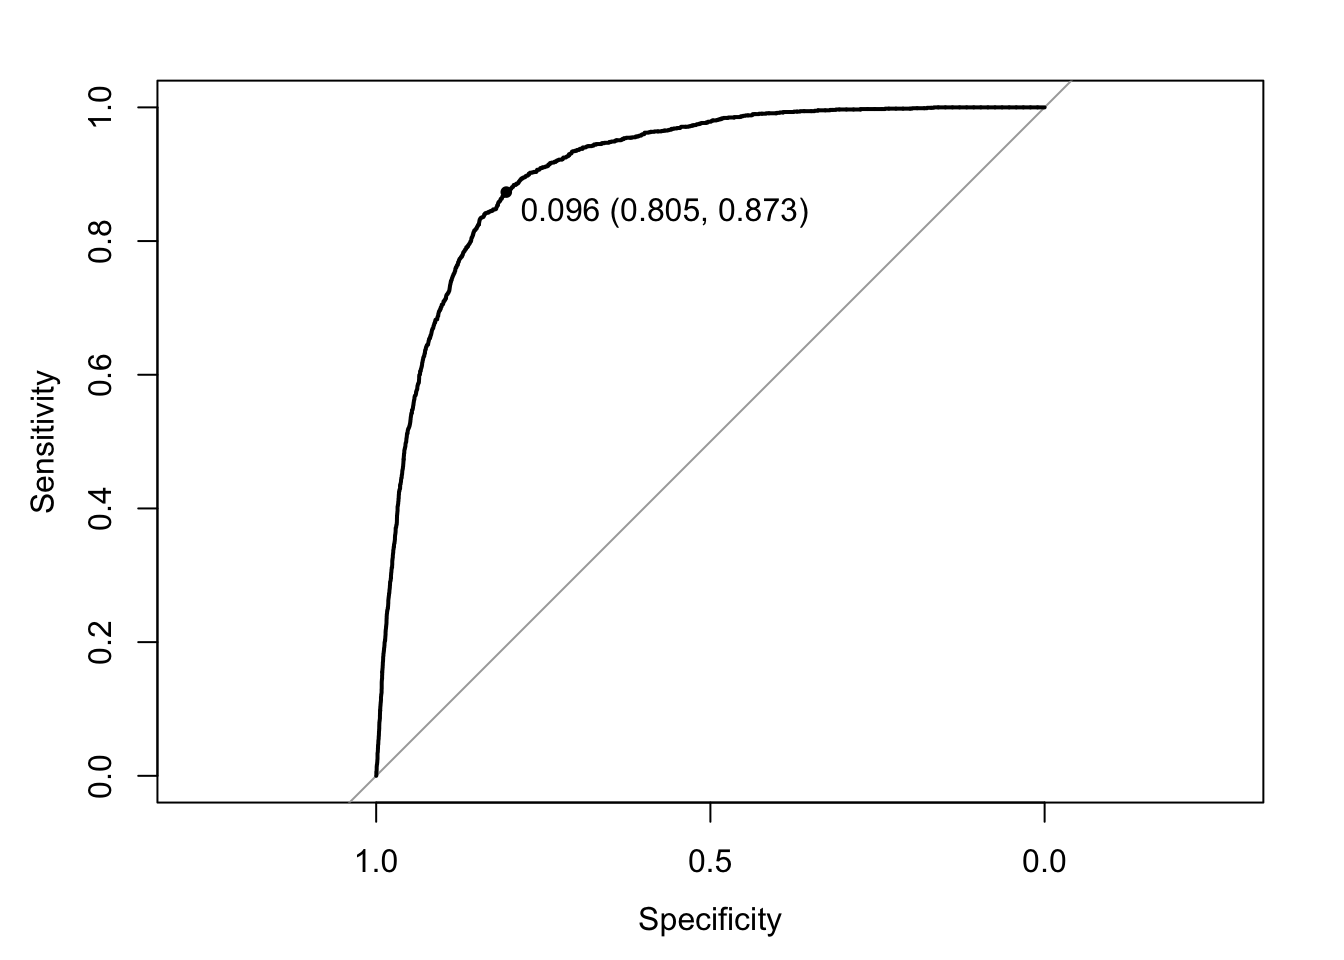
In this section I will build 3 additional classification models to compare to my model in objective 1. The goal of this objective is to build
a model where prediction performance is prioritized. One model should be an attempt at a complex logistic regression model including interaction terms
or polynomial terms. One model should be an LDA or QDA. And the final model should be a nonparametric model such as knn, random forest, classification tree, etc.
Video Presentation
R Markdown
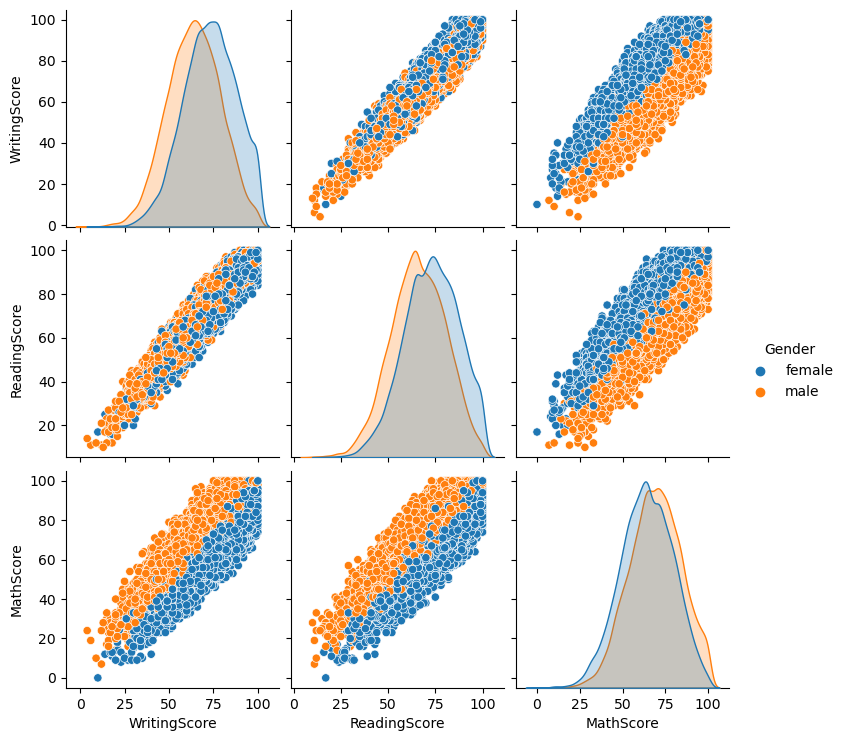
In this section, I will be performing EDA and modeling to predict whether students will pass or fail a specific test. The three subjects represented are
reading, writing and math. Some of the models I'll try out are SVM, Random Forest, and KNN. Addtionally, I will also get my hands dirty with clustering.
This is a group project done with 2 other classmates as part of SMU's Masters in Data Science degree for the class Machine Learning 1.